Tasking on Natural Statistics of Infrared Images
Todd Goodall, Alan C. Bovik, Nicholas G. Paulter, Jr.
Read the full paper here
Abstract
Natural Scene Statistics (NSS) provide powerful perceptually relevant
tools that have been successfully used for image quality analysis of
visible light images. NSS capture statistical regularities that arise
in the physical world and thus are relevant to Long Wave Infrared
(LWIR) images. LWIR images are similar to visible light images and
mainly differ by the wavelengths captured by the sensors. The
distortions unique to LWIR are of particular interest to current
researchers. We analyze a few common LWIR distortions and how they
relate to NSS models.
Humans are the most important factor for assessing
distortion and quality in IR images, which are often used in perceptual
tasks. Therefore, predicting human performance when a task involving
LWIR images needs to be performed can be critical to improving task
efficacy. The National Institute for Standards and Technology (NIST)
characterizes human Targeting Task Performance (TTP) by asking
firefighters to identify the locations of fire hazards in LWIR images
under distorted conditions. We find that task performance can be
predicted using NSS features. We also report the results of a human
study.
We analyzed the NSS of LWIR images under pristine and
distorted conditions using four databases of LWIR images. Each database
was captured with a different camera allowing us to better evaluate the
statistics of LWIR images independent of camera model. We find that
models of NSS are also effective for measuring distortions in the
presence of other independent distortions.
Background
The "Halo
Effect," depicted in the left-most image of Fig. 1, is another
distortion which occurs mostly in thermal cameras equipped with
ferro-electric sensors. This effect causes the region surrounding a
bright object to grow darker and it causes the region around dark
objects to grow lighter. This effect can be caused by both the physical
operation of cameras containing ferro-electric sensors and
back-reflection of IR illumination sources. The "chopper" which
modulates the signal for ferro-electric detectors fails to entirely
shield incoming infrared light which leads to overcompensation when
subtracting the differential response from the average signal producing
a halo. Reflective materials situated next to highly emissive materials
within the scene have also been shown to produce a similar effect.
LWIR images commonly contain hot-spot areas exhibiting
only small variations in image intensity, arising from highly emissive
objects which stand out from the background as in the center image
shown in Fig. 1. In general, LWIR images contain many smooth surfaces
as a result of temperature diffusion. Hot-spots are less a distortion
than a symptom of the environment, but they still produce interesting
statistical regularities worthy of study.
Non-Uniformity (NU) noise as exemplified in the
right-most image in Fig. 1 is a distortion specific to LWIR images. NU
is an additive Fixed Pattern Noise (FPN) which appears as a grid-like
or striping pattern. These patterns result from manufacturing defects,
dark current, and segmented sensor capture areas.
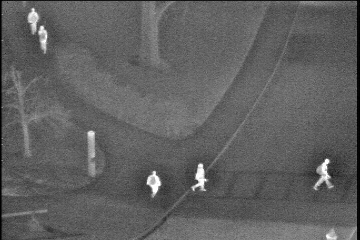

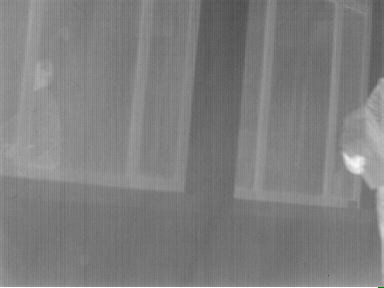
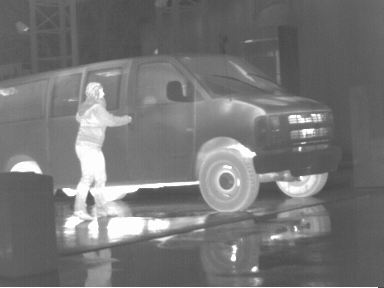
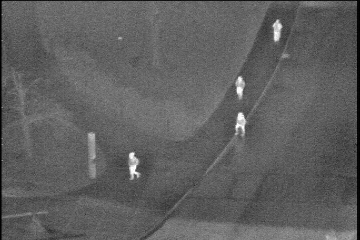
Our study of the NSS of LWIR images has benefited from the availability of four separate IR image databases which we denote as NIST, KASER, MORRIS, and OSU. Example images from each database are provided in Fig. 2. The NIST database includes 180 images from indoor office and home environments each containing multiple hot objects and some containing fire hazards. The KASER database includes 37 images from outdoor environments taken using unknown camera models and suffering various distortions including Non-Uniformity, blur, and noise. The MORRIS database contains both indoor and outdoor images of urban environments including cars, pedestrians, and buildings. Finally, the OSU database contains images captured by a surveillance camera monitoring pathway intersections on the Ohio State University campus. Gathering a diverse set of images from a diversity of cameras allows for better generalization of the NSS of LWIR images.
NIST KASER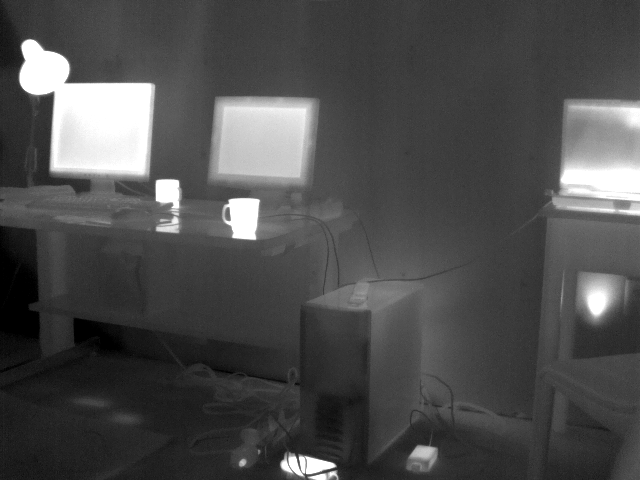
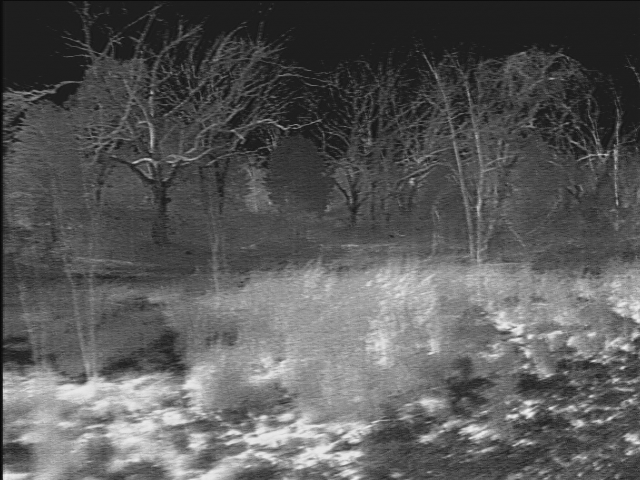
MORRIS OSU
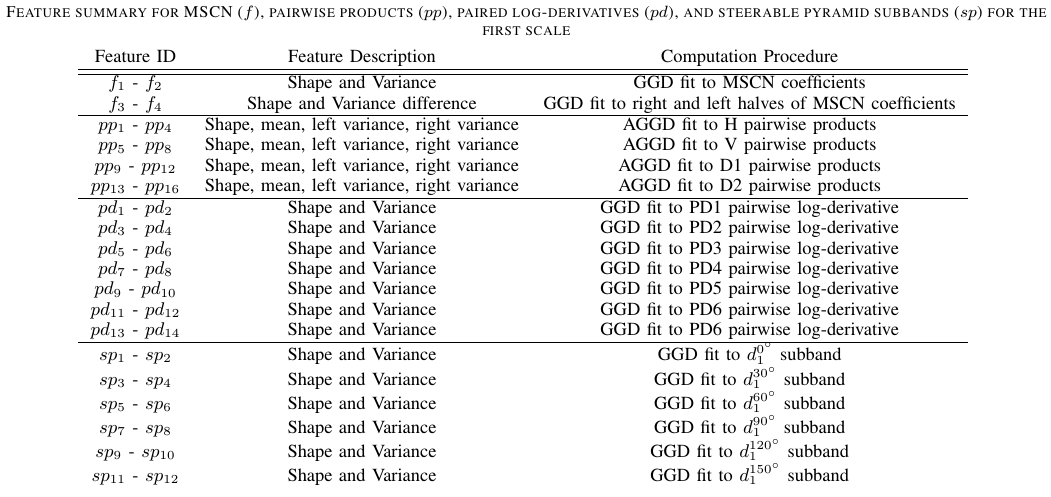
Feature Models
A summary of the features chosen in this work is given in Table 1. Please refer to the paper for an in-depth description of each feature.
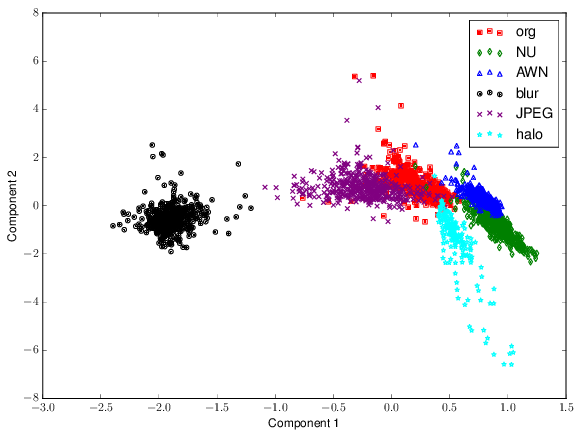
To visualize the clustering of the features over three scales, the features for each distortion class were projected into a two-dimensional space using Principle Component Analysis (PCA) as depicted in Fig. 3. The distorted images appear to cluster in this projection which reasonably preserves their class groupings.
Tasking on NSS
In this section, we study the practical usefulness of the LWIR NSS and IQI features for solving five different visual LWIR tasks. First, we use the features to develop a measure of NU on LWIR images. Second, we devise a method to determine presence of the "Halo Effect." The third task is automated prediction of the ability of human experts to detect targets of interest on LWIR images. Fourth, we describe a human study which obtained subjective quality scores on LWIR images, and show that the NSS features are highly predictive of subjective image quality. Lastly, we will show how the LWIR NSS can be used to create localized distortion maps which can aid the identification of local distortions such as hotspots and occurrences of the "Halo Effect."
We also compare the NSS models to NISTs Image Quality Indicators (IQIs), and find that NSS models yield greater performance for each relevant task.
Measuring NU
In NUC algorithms, producing a no-reference estimate of the NU in an
image is essential. State-of-the-art methods for estimating the
magnitude of NU include the Roughness index, Effective Roughness Index,
and SNR. LWIR images commonly contain both fixed pattern noise and
additive white noise, and the level of both types of noise should be
estimated.
Two weaknesses of current NU estimation approaches are
their inability to capture spatial structure and assumption of
grid-like patterns of FPN, which, in reality, can often be striping.
Additionally, these approaches generally assume that NU is the only
distortion within the image. Often, other noise is present that can
seriously hinder effectiveness in estimating NU. We propose a new
approach to measure the performance of NUC algorithm metrics. We find
that the NSS features, in Table 1, are capable of capturing the type of
NU, the magnitude of that NU, and the amount of Gaussian white noise
that is present.
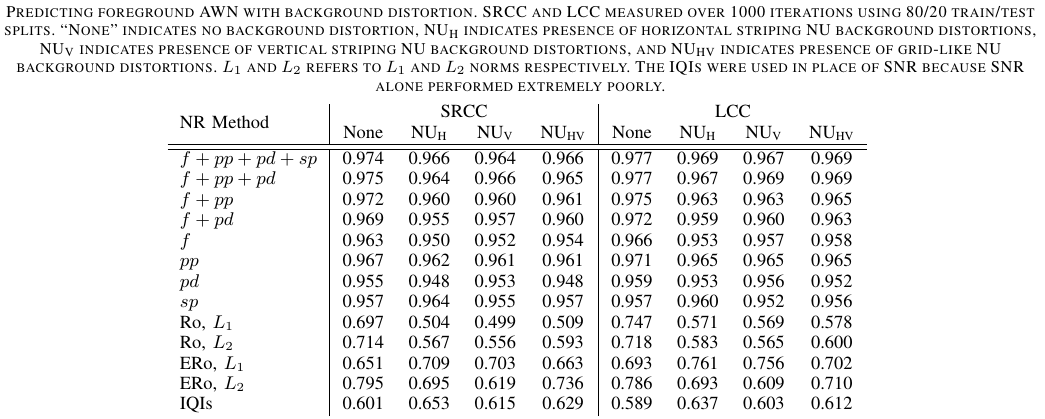
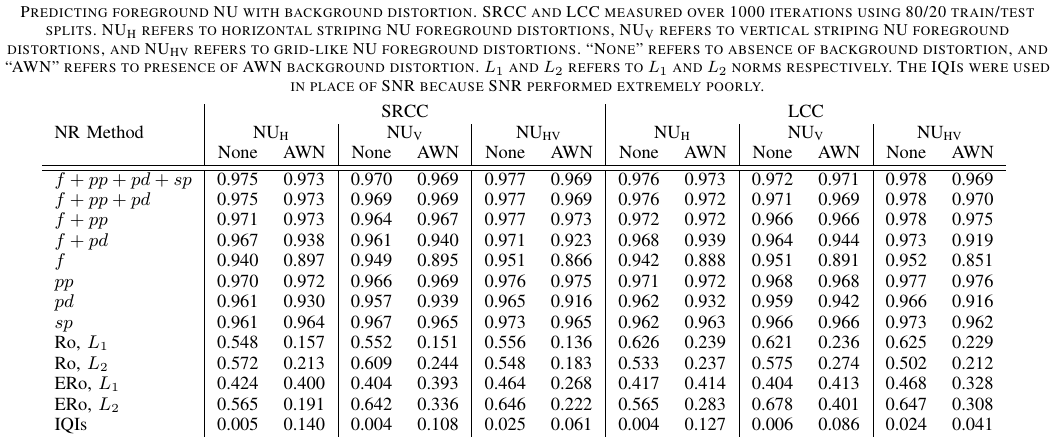
Table 2 shows the correlation of additive white
gaussian noise using combinations of the NSS features and top models.
Background NU noise distortions are applied to varying degrees. Table 3
shows the correlation of NU using the same combinations of NSS features
and top models. Background additive white gaussian noise are applied to
varying degrees. The NSS features are shown to be able to detect the
presence of NU and AWN independent of each other with high correlation.
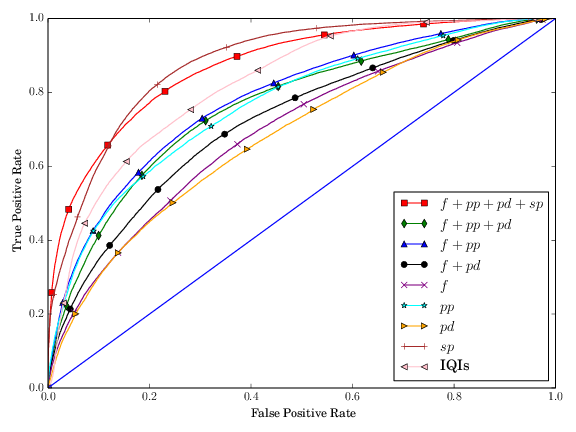
Discriminating the "Halo Effect"
To study how well the "Halo Effect" can be discriminated using our feature models, two sets of image patches (with and without halos) were constructed using background subtraction and manual classification to develop a supervised learner. Most of the image patches were of size 110x110. A total of 415 image patches were contained in both sets, with 227 image patches being halo-free, and 188 patches containing halos.
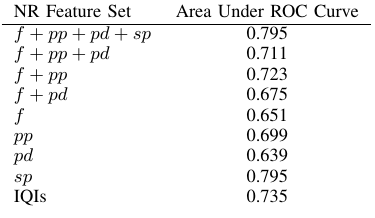
Area Under the Curves for the ROC in Fig. 4.
TTP of Firefighters and Hazards
Researchers at NIST conducted a study involving firefighters whose task
was two-fold. First, given an LWIR image, the expert determined whether
a hazard was present. Second, if a hazard was present, the expert was
asked to identify the location of the hazard. In this study, the
experts were given a stimulus image, and tasked to either identify the
location of the environmental hazard by clicking on it, or by
indicating that there is no distortion. Hits and misses were measured
depending on whether the cursor click was near the hazard. The
probability of hit was computed over all observers.
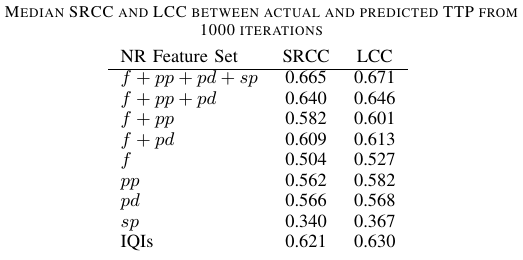
Using the probability of hit, the NSS quality
features, and the IQIs, we used a SVR to estimate TTP. As a way of
comparing the features, the median SRCC and LCC coefficients are
reported in Table 5 from 1000 iterations. Combinations of features
provide the best estimators of TTP, with the combination of all natural
features providing the highest correlations for TTP. Note that the IQIs
in Table 5 use the 13 features, while the degradations to the images
provided in the study made modifications based on the original 4
parameters.
Blind Image Quality Assessment of LWIR Images
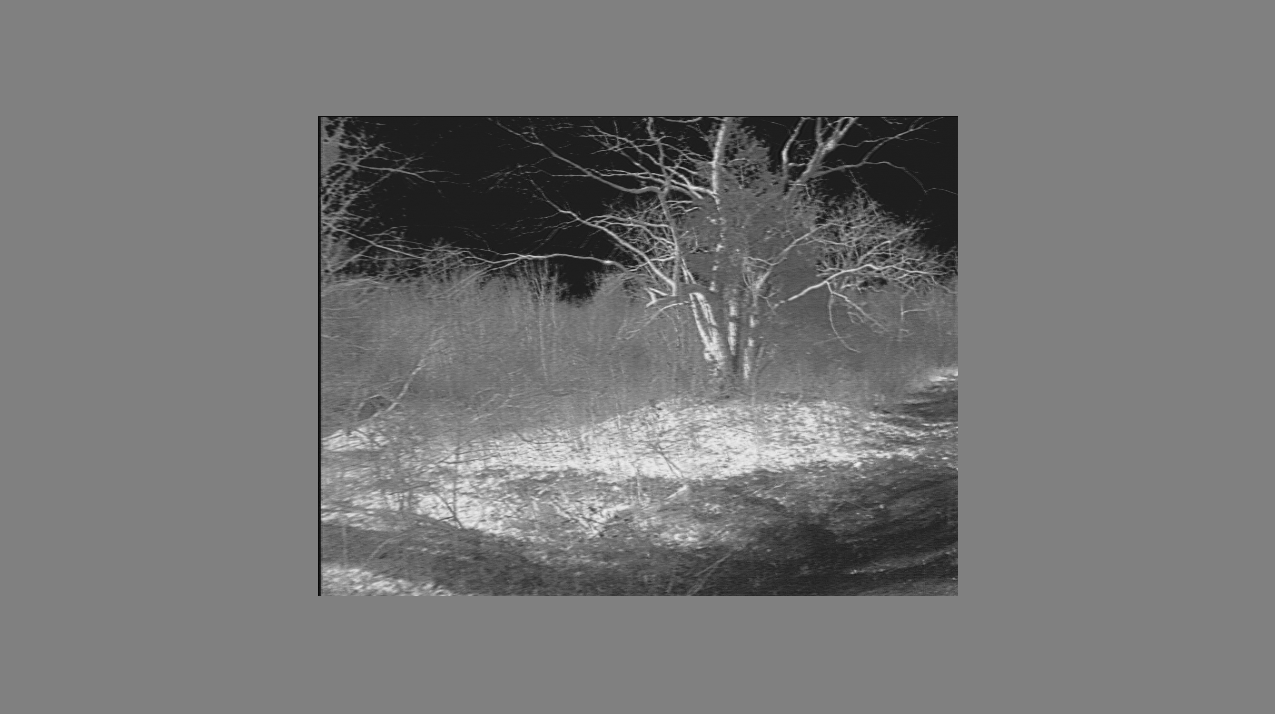
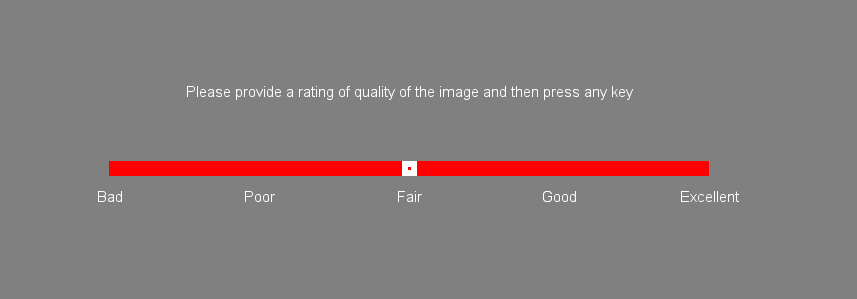
Figure 5. Example Stimulus Figure 6. Slider Bar
We conducted a lengthy and sizeable human study, the results of which
we used to assess how well NSS-based blind image quality prediction
models designed for LWIR images correlate with subjective quality
scores. A collection of 28 indoor and outdoor images were selected from
the NIST and KASER databases as "pristine" images. Artificial blur and
noise distortions were applied to the pristine images. Three levels of
blur, three levels of noise, and combinations of blur and noise
produced a total of 252 distorted images.
Each subject was first presented with a training
session in which 10 images were shown before the main testing session,
to give them an understanding of how to score images. Two testing
sessions were performed with each session containing a unique set of
126 images. Subjects were presented with a single stimulus image for 10
seconds as depicted in Fig. 5. At the end of the 10 seconds, a
continuous sliding quality bar with the labels "Bad," "Poor," "Fair,"
"Good," or "Excellent" was presented, as shown in Fig. 6.
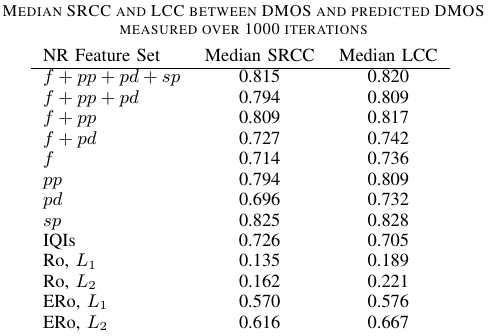
Each image was scored by 24 subjects with each score
discretized to integers on [0, 100]. These scores were then converted
into Difference Mean Opinion Scores (DMOS). Each model discussed thus
far were trained using an SVR and an 80/20 percent train/test split
computed over 1000 iterations. Table 6 shows the validation results,
with the steerable pyramid subband features producing the best
predictor of human judgement.
Local Distortion Maps
Local distortion maps can be useful for identifying local distorted
regions, which can occur as particular local distortions such as
hotspots or halos, or they may arise from some unknown (combination of)
distortions. It is possible to automatically find local distorted
regions of LWIR images using NSS-based features.
A distortion map can be generated using a sliding
window to capture patches from the image being analyzed. We used a
96x96 sliding square window scanned along the image in 12 pixel step
increments (strides). Thus each captured patch overlapped with 87.5
percent of the last patch in sequence. Each patch was classified using
multiple probabilistic SVCs, one per distortion type, to determine the
likelihood that the patch belonged to that distorted class or to the
natural image class. The probabilities of distortion were gathered and
mapped into an image which highlights distorted areas. Example
distortion maps are shown in Fig. 10. Some distortion maps, such as
JPEG appear to provide false positives, but this is an artifact of
relative probability within the map and full-scale contrast stretching.
This technique could be useful for both identifying likely distortions,
and localizing them in an LWIR image.
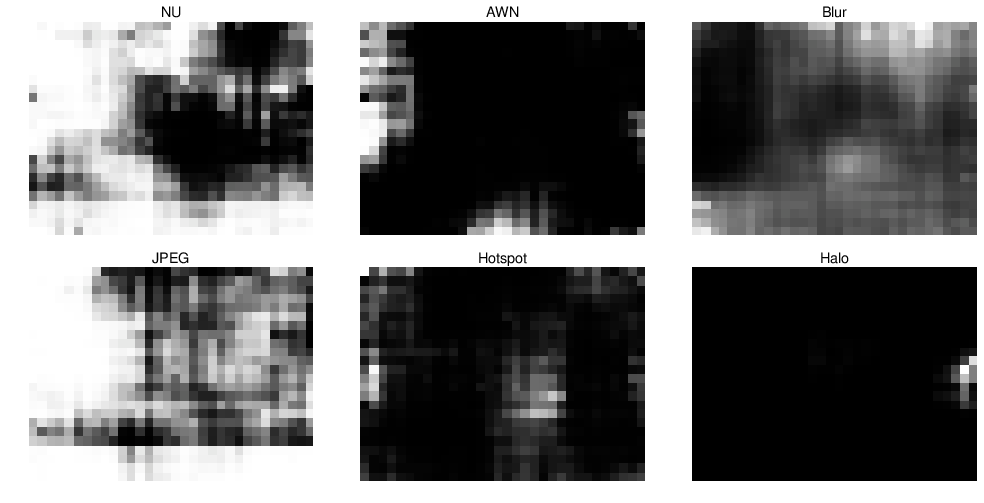
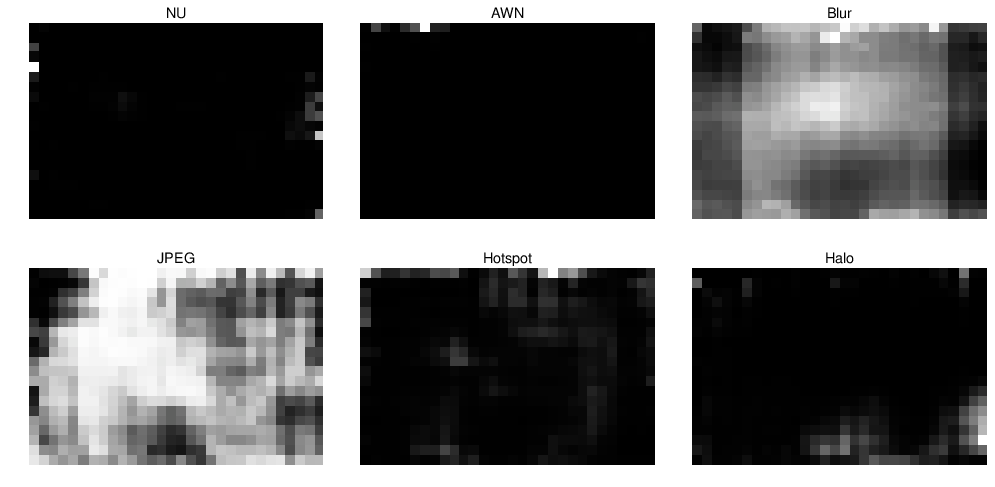
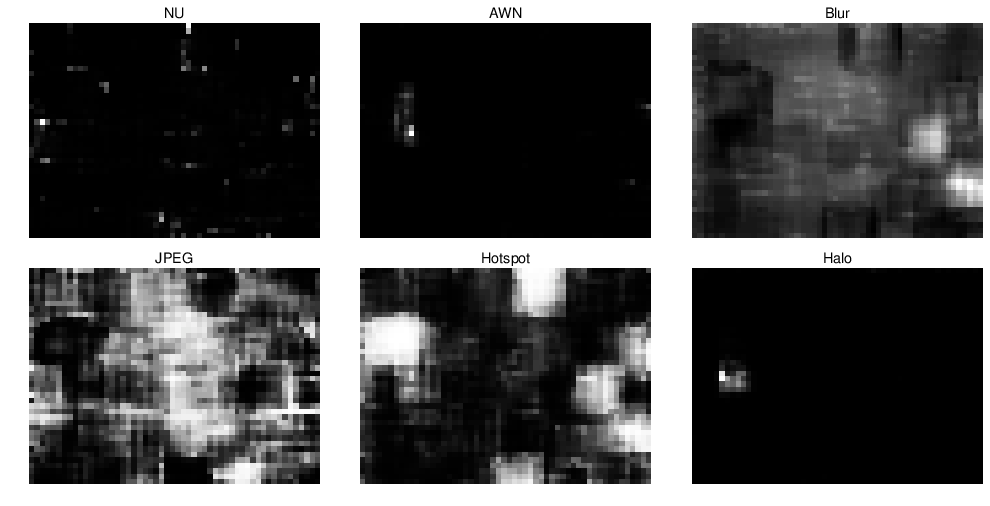
Figure 7. Distortion maps
Conclusion
LWIR images possess statistical regularities similar to those of visible light images. The NSS of LWIR images are powerful descriptors that can be used to find localized distortions, provide global distortion estimates, predict human task performance, and predict human subjective quality scores. Maps of distortions are potentially useful for designing correction algorithms or LWIR image compression methods.
Relevant Publications
T. Goodall, A. C. Bovik, and Nicholas G. Paulter Jr., "Tasking on
Natural Statistics of Infrared Images" submitted to IEEE Transactions
on Image Processing
T. Goodall and A. C. Bovik, "No-reference task
performance prediction on distorted LWIR images" IEEE Southwest
Symposium on Image Analysis and Interpretation, 2014
Image Database References
J. Y. Kaser., Utilizing Natural Scene Statistics and Blind Image Quality Analysis of Infrared Imagery, accessed Oct 11, 2014
url
J. L. Rowe.,
The Impact of Thermal Imaging Camera Display Quality on Fire Fighter Task Performance
ProQuest, 2008
N. J. Morris, S. Avidan, W. Matusik, H. Pfister, Statistics of infrared
images, IEEE Conference on Computer Vision and Pattern Recognition,
2007
J. W. Davis and M. A. Keck, A Two-Stage Template
Approach to Person Detection in Thermal Imagery. Seventh IEEE Workshops
on Application of Computer Vision, 2005