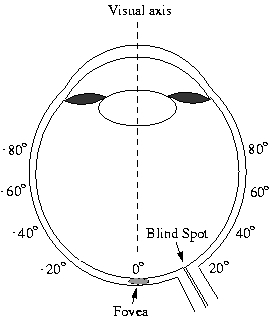
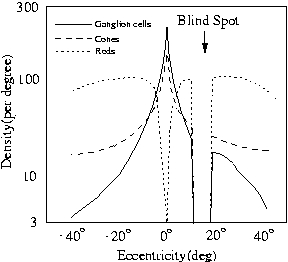
Natural Image Statistics and Human Eye Fixations Umesh Rajashekar, Alan C. Bovik, Lawrence K. Cormack Overview Many seemingly complex visual tasks can be understood by exploiting statistical dependencies in the stimulus. The goal of this project is to understand and emulate aspects of active vision by discovering and modelling low-level statistical image characteristics that attract gaze. The development of such a model will provide the first steps in answering the questions -‘ What do people look at?’ (visual surveillance) and ‘What do people look for?’ (visual search). From an engineering perspective, this information could then be used for modelling efficient (both in terms of storage and speed) attentional mechanisms that direct computational resources to ‘interesting’ regions in the scene as in active vision systems. A bottom-up approach to build a computational/statistical model for low-level visual fixations which can then be used to predict fixations in novel scenarios is proposed. The striking novelty of these approaches is the use of precision high-end eye tracking equipment for collecting the data used for off-line analysis. The image at the point of fixation is then analyzed to extract 'fixation attractors'. Background Central to our multi-resolution visual perception is the dynamic nature in which the eyes execute movements to scan a scene. Despite a large field of view, the human eyes process only a tiny central region in great detail. The decrease in resolution from the center towards the periphery is attributed mainly to the distribution of the ganglion cells on the retina. The ganglion cells are packed densely at the center of the retina (i.e. the foveola), and the sampling rate drops almost quadratically as a function of eccentricity as shown in Fig.1.
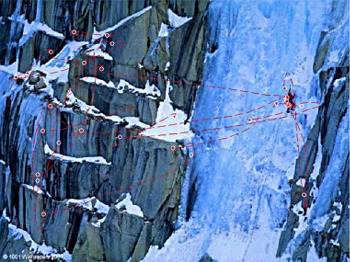
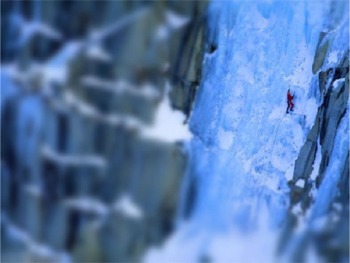
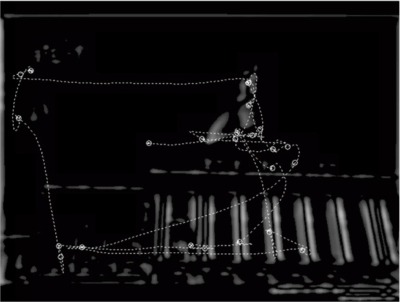
In order to build a detailed representation of a scene, the human visual system (HVS) therefore uses a dynamic process of actively scanning the visual environment using discrete fixations linked by ballistic saccadic (jumps) eye movements. The eye gathers most information during the fixations while little information is gathered during the saccades (due to saccadic suppression, motion blurring, etc.). A typical eye scanpath executed by a person viewing a scene is illustrated in Fig. 2. Fixations are shown by the white circles while the red-dashed line shown a saccade. The multi-resolution retinal representation of the scene while fixating on the climber is shown in Fig. 3. Note how the image resolution falls off as a function of eccentricity from the climber.
Applications This active nature of looking, as instantiated in the HVS via fixations and saccades, promises to have advantages in both speed (corroborated by the few fixation points used to scan the entire image in Fig. 2) and reduced storage requirements (evidenced by the reduced resolution away from point of fixation in Fig. 3) in artificial vision systems as well. The instantiation of automatic fixation models into the next generation of efficient, foveated, active vision systems can then be applied to a diverse array of problems such as automated pictorial database query, image understanding, image quality assessment, automated object detection, autonomous vehicle navigation, and real-time, foveated video compression. Also, the ability to understand and reproduce an expert radiologist’s eye movements could be used in semi-automated detection of lesions in digital mammograms, a problem of vast life-saving significance. The development of foveated artificial vision systems depends on the ability to model these eye movement mechanisms to automatically determine areas of interest in the image. Thus, a fundamental question in the emerging field of foveated, active artificial vision is therefore ‘How do we decide where to point the cameras?’ Obviously, such a theory is needed in order to understand biological vision and it is also, by definition, the most fundamental component of any foveated, active artificial vision system. The interplay of cognition and low-level image features like edges, contrast and motion in influencing eye movements makes the problem of predicting the point of gaze a formidable task. Methodology Most of the work on predicting gaze has focussed on high-level intuition of what features might be interesting. Such an approach might be well suited for a constrained environment but fails to provide a comprehensive theory for eye movement prediction. The development of a generic framework for this problem seems more tractable in a bottom-up approach of extracting and modeling low-level attractors. One may rightly argue that saccades might be guided by high-level understanding of the image. However, when the eye makes relatively large saccades as in Fig. 2, the destination region is scrutinized by the periphery at a very low resolution to be able to attribute the decision of the jump to cognitively interesting details, thus motivating the investigation of low-level image attractors. Many seemingly complex visual tasks can be understood by exploiting statistical dependencies in the stimulus. Two types of experiments are in progress to extract statistical dependencies and answer the questions posed above. In the first set of experiments designed to understand the nature of features that subjects look for while searching for a target, eye movements are recorded in a visual search task. To answer the question of what is being analyzed during a fixation, the Classification Image Paradigm is introduced in a novel scenario of eye movements. The approach is truly cognition-free since the entire analysis is done by analyzing structure in noise. Secondly, in a task-free viewing mode, subjects are instructed to view natural images and their eye movements are tracked and recorded. The problem of finding image features from the image patches at point of gaze then boils down to an unsupervised pattern classification of image regions at the points of gaze. Minimum representation error (Principal Component Analysis) constraints and information theoretic flavors (Independent Component Analysis) of ‘commonality’ are then applied to the data set to examine the possibility of extracting kernels that can then be used to predict regions of interest in novel situations. This could then be used for driving the cameras in foveated active vision systems to visually informative regions, used as a probability map for space varying image analysis (for e.g quality assessment), and when combined with features of a target, in foveated object search and detection and many other attention oriented tasks as discussed earlier. |
||||||||||||||
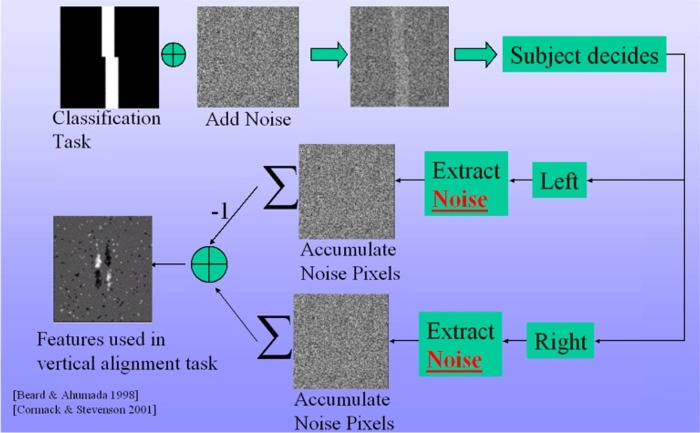
Visual Search Experiments - Classification Image Paradigm The classification image paradigm was originally developed to determine exactly what information was being used in simple visual classifications. The idea was to embed in a classification task sufficient amount of visual noise so that the overall signal-to-noise ratio, and hence the outcome of the classification task, is largely determined by the external added noise. This task is repeated many times with different added noise in each trial. The noise from each trial when the observer makes a given response is then saved and averaged together. Over many trials, image pixels in each ‘bin’ that contribute to the decision add up while the ones that do not contribute average to zero (assuming zero mean noise) and the resulting ‘classification image’ represents the linear contribution (or weight) of each pixel in determining that particular response from the subject.
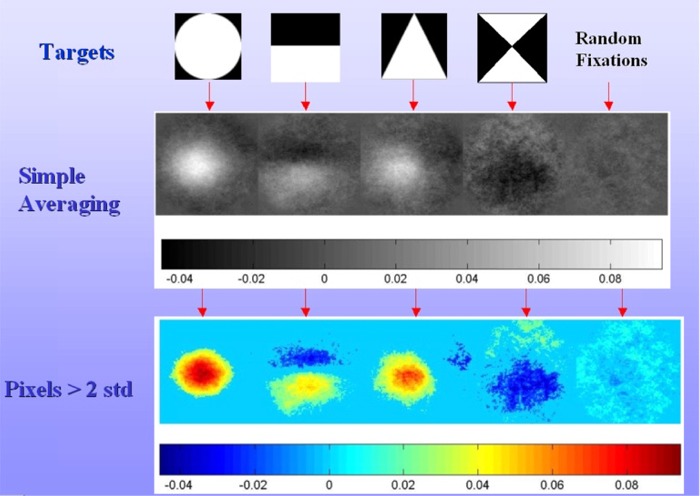
For illustration purposes, assume that two bars should ideally be in vertical alignment but, are in practice always offset one way or the other as shown in Fig. 4. In each trial, the bars are embedded in noise to limit performance, randomly offset top-leftward or -rightward, and then briefly presented to the subject. The classification image paradigm is designed to reveal image features the HVS uses to decide if the bars are shifted to the right or to the left. If the subject responded ‘rightward’ or ‘leftward,’ the noise for that trial is averaged into the ‘right’ or ‘left’ image, respectively. At the end of the experiment (generally 10,000 trials run over several sessions), definite filter properties begin to emerge in the two average images. The images are differenced and thresholded for statistical significance (pixels within 2 standard deviations of the mean can be set to gray, for example). A classification image from a nearly identical experiment is shown in Fig. 4. The subject seems to be using elongated, vertical, odd-symmetric ‘filters’ sensitive to the horizontal shift of the bars to make the decisions. It quite clearly reflects a plausible decision criterion used for the task. This methodology is extended for the first time to eye movements by investigating discrimination results at point of gaze. This approach has two fundamental advantages. First, it extracts low-level features derived directly from the linear contribution of each stimulus pixel in attracting gaze. Second, since the stimuli are composed of random noise, there are no high-level features of cognitive or emotional interest to interfere with the image-based mechanisms determining gaze position. In the experiment, subjects were instructed to search for simple targets like circles, triangles etc. in a 1/f noise image. Eye movements were recorded while subjects performed the task and then the noise at each of the fixations was averaged to build a classification image. The simulation in Fig 5 shows a developing CIP as a subject searches for a dipole in 1/f noise. To delivery clarity in the results, the bottom right image show the pixels in the classification image that are greater than two standard deviations.
Discussion The classification images for various targets are shown in Fig. 6. This discrimination image represents the feature that, when seen in the periphery of the visual field, draws the gaze for closer inspection.The result of randomly sampling the search space for a target is shown in the rightmost column. Clearly, this image is tending towards an image with no specific structure. The observer, unlike the random fixation case, seemed to attend to a small, central portion of dipole, perhaps weighting the lower white portion more. For the case of a circle, the subject seemed to be fixating at points which have a bright region with a dark background while for the triangle, the subject seemed to be searching for a white region and the sharp diagonal right edge of the triangle. The visual system seems to be actively seeking out potential edges, rather than just searching for a bright or dark blob, or casting the eyes about randomly in hopes of fortuitously acquiring the target. What makes this technique truly intriguing is that the structure discovered by the DIP algorithm is obtained from the noise structure alone. Since the target features vary in their position in each fixation patch (the subject need not fixate exactly at the same spot in the feature), it is possible that many interesting features in the images are getting swamped in the averaging process. Shift invariant analysis can be used to handle this problem.
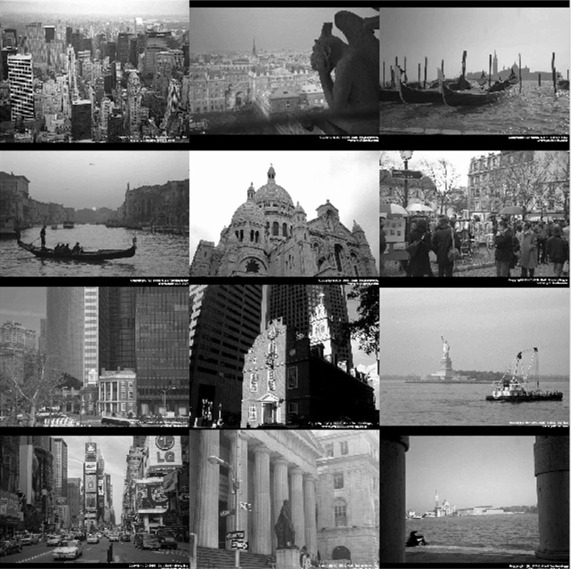
Visual Surveillance Experiments - Principal Component Analysis The goal of the visual surveillance experiments is to extract low-level image features that attract a human's visual attention when there is no visual task at hand. Information of this kind can then be used to design the fixation pattern of active foveated machine vision systems to make them "look around the world as humans do". In the In the free viewing experiments, subjects were shown gray scale images of both natural and man made scenes and instructed to view the scene as if they were in an art gallery. The subject viewed the image until he/she was confident of being able to describe the scene to someone. The ensemble had about 100 images in each category. Fig. 7 illustrates some of the images from the manmade images ensemble.
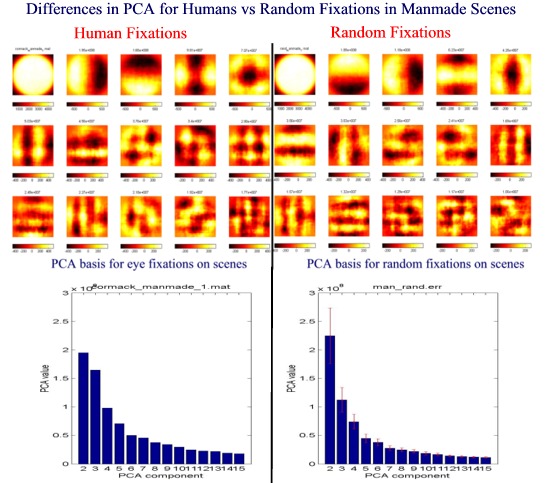
The eye movements for the subjects was recorded and the image patches at the point of fixation were then subjected to PCA to extract "common information" at the point of fixation. The filter kernels obtained from the PCA eigenvectors produce outputs that are uncorrelated with each other. This aspect of uncorrelated outputs has an analogy of the neurons in the visual circuitry, trying to reduce any linear redundancies in the input images. PCA Results Shown in Fig. 8 are the results of applying PCA on about 3000 fixations on a database of manmade images. The left panel in Fig. 8 shows the first 15 eigenvectors for human fixations arranged in ascending order of eigenvalues from left to right and top to bottom. The first eigenvector just reflects the butterworth filter used for the masking and is of not computational significance. The second eigenvector shows a clear vertical component indicating that vertical edges attracted the eye. Component 3 shows a horizontal orientation while the next few components act like bar detectors. The bottom left panel in Fig. 8 shows the corresponding eigenvalues. (Note: The eigenvalue of the first component is not shown). The right panels in Fig. 3.8 illustrate the same principle but are obtained by selecting arbitrary fixations from the same database.
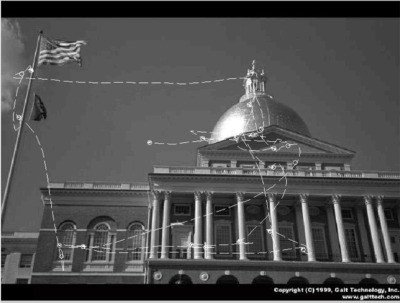
Discussion It is very interesting to note that even though the second eigenvector for random fixations was actually horizontal, indicating the abundance to horizontal edges as against vertical edges in the the ensemble, the eye seemed to select vertical components. The corresponding eigenvalues also illustrate that horizontal components are more significant than vertical ones.While the PCA results for the random points remains similar, the eigenvectors for different subjects do vary. The filter kernels can now be used to filter images and regions with a high response can be used as possible fixation regions. An example of using the eigenvectors as linear kernels follows. Fig. 9(a) shows the recorded eye movements for a scene. The second eigenvector for the human fixations was chosen as a linear kernel and the image was filtered using this kernel. The resulting filtered image was then thresholded to give the results in Fig. 9(b) where the bright regions are fixations areas as predicted by the second PCA component. The fixations in the eye scanpath for a subject viewing the scene are shown by the dotted lines in the same figure. It is interesting to note that many of the regions that the subject viewed (for e.g. the dome and the vertical columns of the building) were correctly predicted by this simple PCA eigenvector (which in this case happens to be a vertical bar detector).
Relevant Publications
|
||||||||||||||