Video quality assessment accounting for temporal visual masking of local flicker
Introduction
Digital videos have become pervasive in our daily life. Given the dramatic growth in purveyed video content and heightened user expectations of higher-quality videos, it is desirable to develop more accurate and automatic VQA tools that can be used to optimize video systems, towards providing satisfactory levels of quality of experience (QoE) to the end user. One potentially important aspect of the design of VQA models that remains poorly understood is the effect of temporal visual masking on the visibility of temporal distortions. The mere presence of spatial, temporal, or spatiotemporal distortions does not imply a corresponding degree of perceptual quality degradation, since the visibility of distortions can be strongly reduced or completely removed by visual masking. Recently, Suchow and Alvarez demonstrated a striking “motion silencing” illusion, in the form of a powerful temporal visual masking phenomenon called change silencing, wherein the salient temporal changes of objects in luminance, color, size, and shape appear to cease in the presence of large, coherent object motions. This motion-induced failure to detect change not only shows a tight coupling between motion and object appearance, but also reveals that commonly occurring temporal distortions, such as local flicker, can be dramatically suppressed by the presence of motion.
Motivated by the visual change silencing phenomenon, we have investigated the nature of spatially localized flicker in natural digital videos, and the potential modeling of temporal visual masking of local flicker to improve VQA performance. We exploit a psychophysical model of temporal flicker masking on digital videos to create an improved VQA model. Specifically, we use the temporal flicker masking model to augment the well-known MOVIE Index. Using the results of a series of human subjective studies that we previously executed, we have developed a quantitative model of local flicker perception relating to motion silencing to more accurately predict video quality when there is flicker. We also have analyzed the influence of flicker on VQA in terms of compression bitrate, object motion, and temporal subsampling. This is an important step towards improving the performance of VQA models, by accounting for the effects of temporal visual masking on flicker distortions in a perceptually agreeable manner, and by further developing MOVIE in the temporal dimension related to flicker.
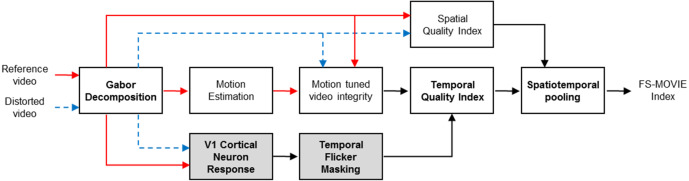
The proposed model, called Flicker Sensitive–Motion-based Video Integrity Evaluation (FS-MOVIE), computes bandpass filter responses on reference and distorted videos using a spatiotemporal Gabor filter bank, then deploys a model of the responses of V1 neurons through an energy model of motion perception and a divisive normalization stage. FS-MOVIE modifies MOVIE by responding to spectral separations caused by local flicker. This internal flicker visibility index is combined with motion-tuned measurements of video integrity, temporally pooled to produce a final video quality score. Our evaluation of the specific performance enhancements of FS-MOVIE, along with the overall comprehensive results, show that the video quality predictions produced by FS-MOVIE correlate quite highly with human subjective judgments of quality on distorted videos. Its performance is highly competitive with, and indeed exceeds, that of the most recent VQA algorithms tested on the LIVE, IVP, EPFL, and VQEGHD5 VQA databases. The significant improvement of VQA performance attained by FS-MOVIE implies that temporal visual masking of local flicker is important.
Relevant publication
- L. K. Choi and A. C. Bovik, "Video quality assessment accounting for temporal visual masking of local flicker," Signal Process. Image Commun., vol. 67, pp. 182-198, Jun. 2018. (PDF)
Fig. 1. Overall workflow of the proposed flicker sensitive motion tuned VQA model, FS-MOVIE.
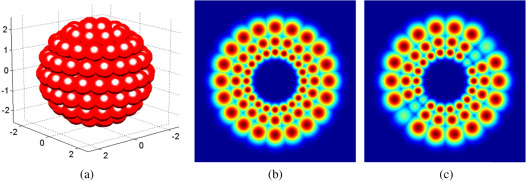
Fig. 2. Gabor filter bank in the frequency domain. (a) Geometry of the Gabor filter bank. (b) A slice of the Gabor filter bank along the plane of zero temporal frequency. (c) A slice of the Gabor filter bank along the plane of zero vertical spatial frequency.
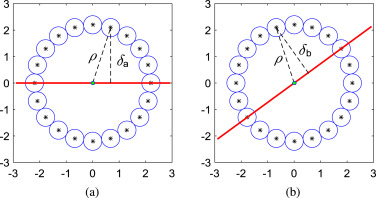
Fig. 3. The motion tuned spectral planes relative to a slice through the Gabor filter bank at one scale: (a) at a static region and (b) at a moving region. The horizontal and vertical axes are spatial and temporal frequency, respectively. The red solid line indicates a spectral plane, while blue small circles represent Gabor filters. The centers of each Gabor filter are marked. ρ is the radius of the sphere along which the center frequency of the Gabor filters lies. δa and δb are the distances of the center frequency of one Gabor filter from the spectral plane at static and moving regions, respectively.
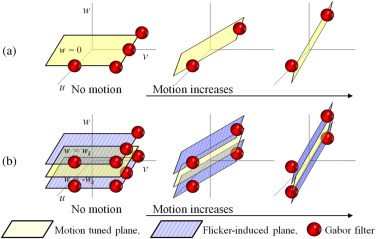
Fig. 5. Spectral signatures that constitute motion tuned planes: (a) Reference video. (b) Flicker video.
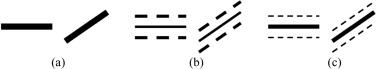
Fig. 6. Schematic illustration of spectral signatures constituting motion tuned planes: (a) No flicker video, (b) flicker video with large flicker magnitude, and (c) flicker video with small flicker magnitude. The solid line is a reference motion tuned plane, while the dashed line is a flicker-induced plane. The thickness of the lines shows the magnitude of the V1 responses. From left to right, videos are static and moving, respectively.
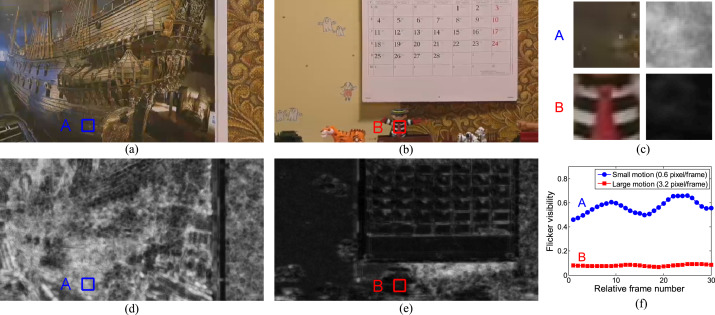
Fig. 7. Illustration of the perceptual flicker visibility index. (a) Frame 48 from the H.264 compressed video containing small motions. (b) Frame 464 from the H.264 compressed video containing large motions. (c) Segments A and B of (a) and (b) as well as (d) and (e). (d) The flicker visibility map of (a). (e) The flicker visibility map of (b). Note: Brighter regions indicate larger predicted flicker visibility. (f) Average flicker visibility at segments A and B along 30 frames. Test videos and corresponding perceptual flicker visibility map videos are available at http://live.ece.utexas.edu/research/flicker/flicker_visibility.html.
Table 2
Comparison of VQA algorithm performances on the LIVE, IVP, EPFL, and VQEGHD5 VQA databases: (A) Spearman Rank Ordered Correlation Coefficient (SROCC) and (B) Pearson Linear Correlation Coefficient (PLCC) between the algorithm prediction scores and the MOS or DMOS.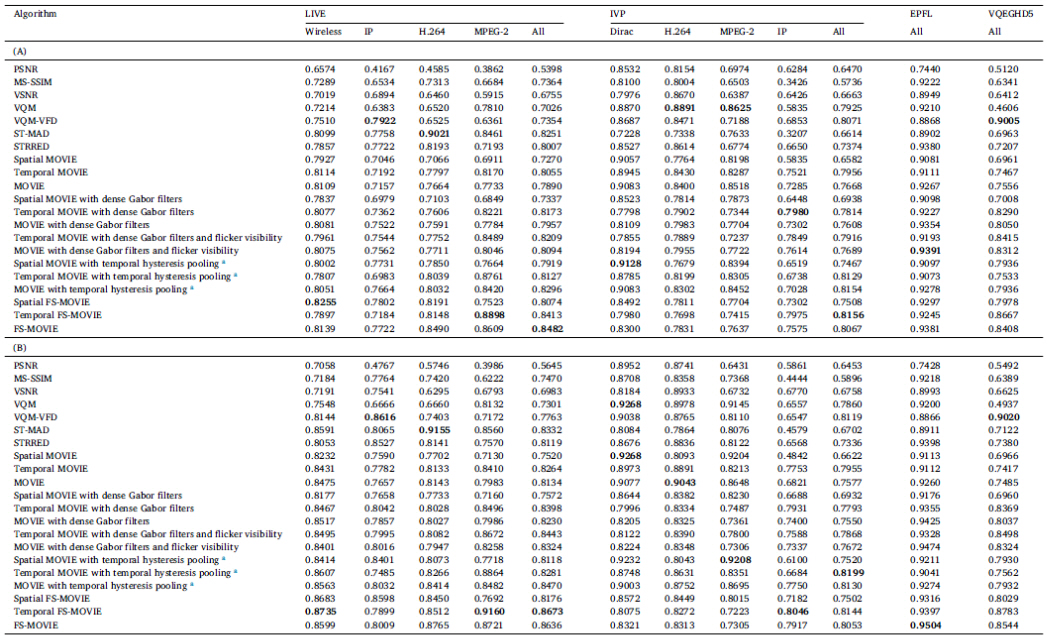
Table 3
Statistical analysis of VQA algorithm performances on the LIVE, IVP, EPFL, and VQEGHD5 VQA databases. The symbol ‘1’ in the table indicates that the row (algorithm) is statistically better than the column (algorithm), while the symbol ‘0’ indicates that the row is worse than the column; the symbol ‘-’ indicates that the row and column are not significantly different. The symbol ‘×’ denotes that the statistical significance could not be determined since the Gaussianity was not satisfied in the F-test. In each cell, entities denote performance on the LIVE, IVP, EPFL, and VQEGHD5 VQA databases, in that order.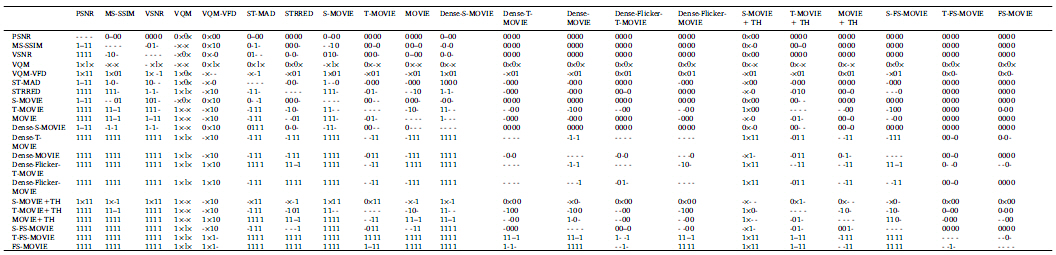
Back to Flicker Perception on Digital Videos page